The 435 members of the House of Representatives represent the people of specific geographic areas. Those areas are drawn up to include equal populations.
The population of a Congressional District is currently about 762,000 people. The intent is for each citizen and 762,000 of his close friends to have a voice in Congress.
This necessarily means that Congressional Districts have vastly different geographic sizes and shapes reflecting different population concentrations. Alaska has only one Congressional District covering the entire sparsely populated state, while one of the 26 Congressional Districts in New York State is just a few square miles of densely populated Manhattan.
Because populations change and shift, Congressional Districts must be redrawn periodically. (It’s different for the Senate where each state gets two Senators regardless of population, and the boundaries of states don’t change.)
The natural question is, who draws up these ever-changing Congressional Districts?
A computer program could do it in milliseconds. Give it a few factors to consider such as natural geographic boundaries, and then ask it to draw up random equal-population globs on the map.
Ah, but simplicity and logic in government are usually subordinated to the political needs, incompetence and corruption of politicians.
In the case of drawing up Congressional Districts, those politicians are among the worst of their kind – state legislators. You know, those brilliant statemen who take a few months off from their ordinary jobs as rocket scientists and brain surgeons in order to inflict on the population of their state whatever legislation best meets the needs of their donors.
The needs of their donors can be summed up with: “Maximize my power by maximizing my political party.”
The legislators thus draw up districts that favor their party. A seventh grader from yesteryear, or a PhD from today, can see how this is easily done. You simply draw the districts so that the majority party has a majority not just in the state as a whole, but in each district.
Say a state has a population of 7.62 million, with a total number of Congressional Districts of 10 (because 7.62 million people divided by 762,000 people per district equals about 10 districts). Say further that about 3.16 million are Republicans and the other 4.46 million are Democrats (or at least tend to vote that way) for a party split of about 60/40 between Democrats and Republicans.
In an ideal world, the districts might be drawn such that the party split between Democrat and Republican Representatives is about the same as the party split between Democrat and Republican voters – about 60/40 – and so there would be 6 Democrat Representatives and 4 Republican ones.
In the real world, however, here’s where it gets mischievous. In my example, the state legislature is probably controlled by the Democrats, since 60% of the voters are Democrats.
That Democrat legislature will be motivated to “gerrymander” the Congressional Districts to maximize the number of Democrat Representatives and minimize the number of Republican ones.
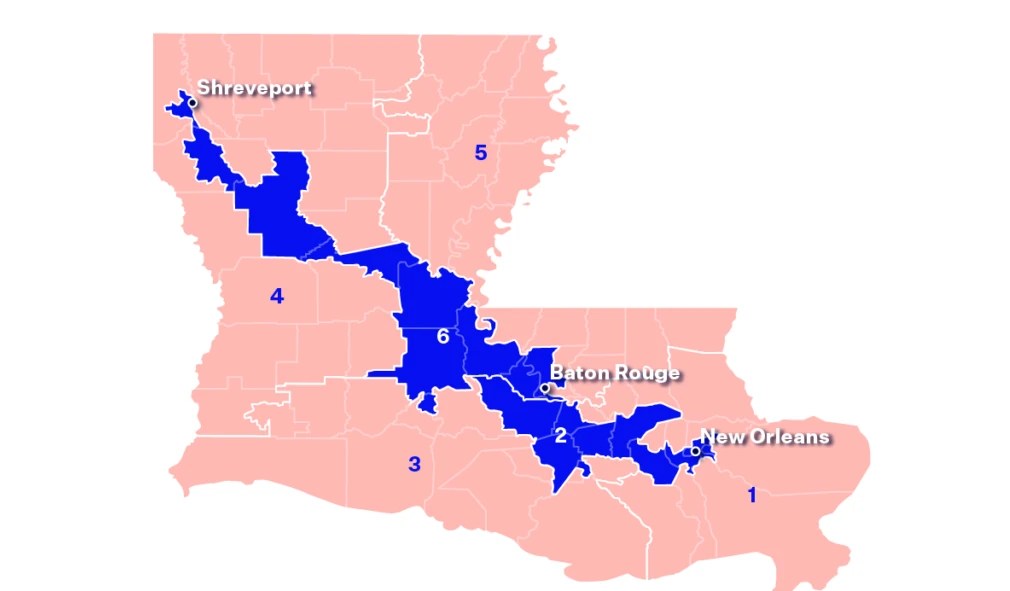
They achieve this by drawing the Congressional Districts in such a way that Democrats have at least a small majority in every Congressional District. If a map shows a Republican majority in a district, then they shift the geographic boundary of that district to borrow from an adjoining district where the Democrat/Republican split is more favorable. The outcome can be weirdly-shaped districts, such as shown on the above map of Louisiana.
Gerrymandering is always possible, because a statewide political split won’t be reflected in every county and every precinct. Rural counties tend to lean Republican, while urban counties tend to lean Democrat. If the legislature needs a few more Democrats in order to have a majority in a rural district, just shift the district boundary to borrow some from the nearby city.
In my example, that could mean the ten districts in the state wind up with Democrat/Republican splits of something like 55/45, 60/40, 57/43, 62/38, and so on. With their 60/40 overall advantage, the Democrats have plenty of votes to spread around in order to have a majority in each of the ten districts.
This result is odd, and arguably not intended by the Founders. In a state where Republicans have 40% of the voters, they wind up with zero Congressional Representatives. And, of course, they wind up with zero Senators as well, since Senators are elected statewide in this state that is 60% Democrat. Millions of Republicans in a Blue state can be left with no representation in Congress.
In my example above, Democrats are the gerrymanderers. But a recent example of gerrymandering was by Texas Republicans who, spurred on by President Trump, gerrymandered their state to shift about 5 House seats from Democrat to Republican. Democrats are poised to return the favor in Virginia and California, while Republicans are poised to re-return the favor in Florida. We have full-on gerrymandering wars.
Gerrymandering is a volatile issue. It seems at odds with representative government because it allows the majority party to not just out-vote the minority party, but to lock them out of government altogether, at least in a given state’s Congressional delegation.
In the preceding paragraph, I used “minority” in the numerical sense, as in the “minority party” as distinct from the “majority party.” When “minority” is used in gerrymandering in the racial sense, the matter becomes not just volatile, but explosive. That’s the subject of a long-overdue Supreme Court decision this week, which I’ll discuss in my next column.

This has all occurred due to the passage of the 17th Amendment. By allowing direct election of Senators, the Seventeenth Amendment to the United States Constitution weakened state influence, strengthened party control, and, in my view, undermined the Republic’s original design.
Good article – why are there not restrictions on the geometric ratio of district boundary length ( or circumference)to district area? Long but skinny districts are probably more often rigged, and these would have a higher boundary length to area ratio for example.
That’s often true. But sometimes it’s not. A long skinny district might correspond to natural geography, as in a valley for example.